7 January 2015 · Dean Hume
HTML5 Charts using Chart.js
Let's face it - everyone loves a good pie chart! Using charts makes information much easier to visualize. It is easier to see a pattern in a chart, but much more difficult when looking at raw data. In fact, there are loads of different web based charting solutions available to us as developers. Finding a solution that isn't too complicated or requires you to pay for commercial use can be a bit tricky.
If you are looking for a simple charting solution that looks great, I recommend checking out Chart.js. The JavaScript library is open source and provides 6 different chart types - each of them can be animated, and come with a load of customisation options and interactivity extensions. Plus they look great too!
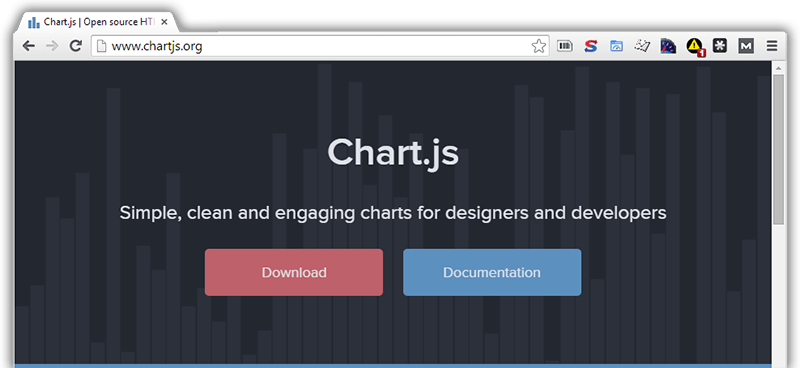
Chart.js uses the HTML5 canvas element, which is great because it means that it is supported in all modern browsers. Polyfills can also be used to support Internet Explorer 7 & 8.
To give you an idea of what the charts look like, the example below is a standard line chart.
See the Pen MYjyyR by Dean (@deanhume) on CodePen.
Another example using the pie chart.
See the Pen PwGNje by Dean (@deanhume) on CodePen.
In terms of web performance, Chart.js is super lightweight and comes in at just 11.01kb. Another added bonus is that Chart.js is responsive and will resize your chart depending on the device that you are serving.
Happy charting!


