Measuring Web Page Performance with Selenium 2 and the Web Timings API
I have always been interested in measuring web performance, and especially in measuring the improvements in performance. A while ago I attended a Selenium Meetup in London and heard an interesting presentation by one of the QA guys working at Mozilla. He talked about measuring the performance of a web page over a period of time using Selenium 2 and logging these statistics so we can track client-side performance improvements.

Only recently I came across one of his articles that talked about using the built-in Web Timings API that most new browsers use. IE9, Chrome, and Firefox are adding a new API for web pages and it is also a standard that is being introduced by the W3C. This is great news for us as developers, and it enables us to benchmark our performance over a period of time. Imagine every time your set of Unit Tests run when you check in and at the same time it logs the page metrics. As you add new functionality or improve on page speed, the tests would log these metrics. This would allow us to chart the improvements / decrease in performance with real stats - awesome!
I have to be honest, most of this idea is inspired by the article on his site. I wanted to put it all together and provide a quick page to view these statistics. Let's take a look at the steps.
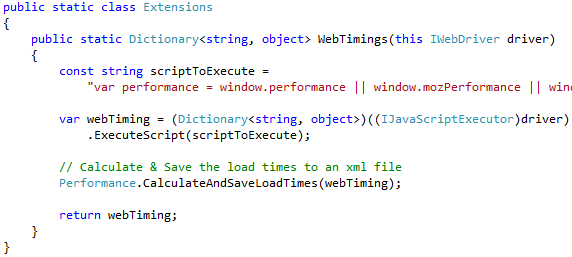
Firstly, I used the standard method that was provided.

I created a class that calculates the performance metrics and saves them to an XML file for us to retrieve later. I won't go into detail about that class, except that it basically takes page timings and uses the values to calculate a more readable value in milliseconds and saves them to an XML file. A few of the timings might look something like this:
connectStart: 1280867125399
connectEnd: 1280867125489
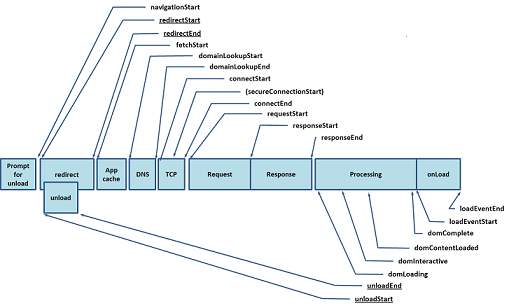
If you notice, it isn't entirely readable but if we take the connectEnd and minus it from the connectStart - we get a more readable value in milliseconds for the connect time. Just to give you an idea of how the timings work, here is a diagram showing the overview of the timings.

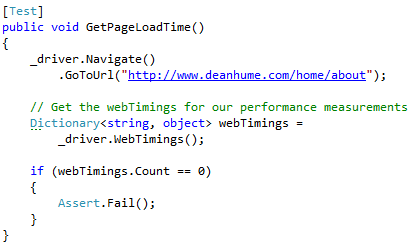
Once the extension has been added you simply use it on your unit test like so:

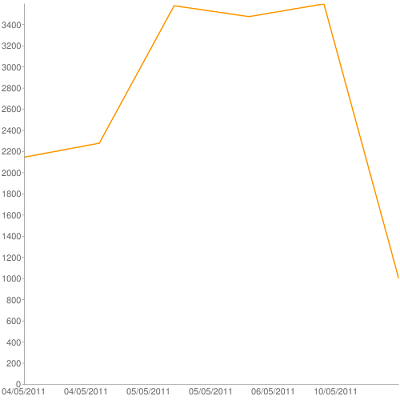
Lastly, I added a small .net MVC application that reads the XML files that have been created over a period of time and displays them using a Google Chart. This gives us a basic overview of our performance history

If you notice the change in the chart, you can see that as more functionality was added the chart peaked. Towards the end of the chart, and the most recent data, you should notice that the load time dropped.
I have included a small project that details the work that I did to get this up and running. Please click here to download.
