MVC and the Google Visualization API (DataTable)

Google have created an awesome visualization API. It enables you to add live charts, graphs and tables to your web pages. It is quite flexible and has some great features that are quite easy to use once you get started. I started playing around with this API and decided to build a datatable using ASP.net MVC and the visualization API.
Click here to view a simple demo.
Let's start off by adding a reference to the latest jQuery library. Then we will need to add another reference to the Google API script. And finally, we are going to use a Javascript file to write our code to create the table.

Add a Javascript file to your project, let's call it "TableResults.js". Add the code below to your Javascript file. I have broken this down into two separate parts for easier readability.
Okay, let's break this code down to get an idea of what's going on.
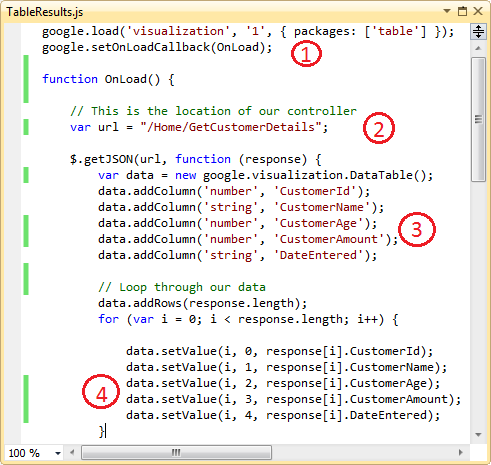
1. Initially we are loading the Google Visualization API and instructing it to use the tables package.
2. This is the location of our MVC Controller that we want to post to.
3. Add the Column names and data types.
4. Loop through all the results that we got back and set the data to the appropriate column.
And now the second part of the file:
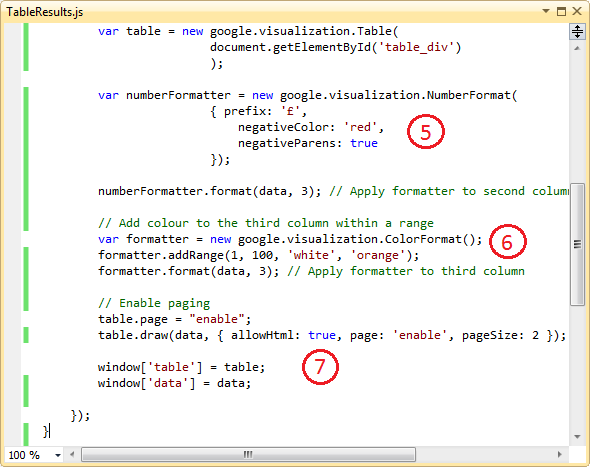
5. We are adding a Number Formatter to the column. If the number is negative, we change the column to red. We are also prepending a currency symbol in front of the value. This is an optional feature that you can use to jazz up your table.
6. This is another Column Formatter, but this time we are adding a colour to the column if it falls between certain range. Again, this is optional.
7. Finally, the paging is being enabled and the paging size is being set to 2. The reason I am setting it so low is because I am only returning a small amount of data for this demo. You may want to set this higher depending on your preferences.
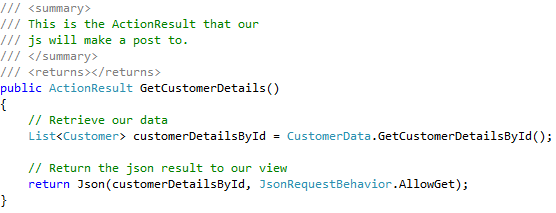
Next, add a method to our Controller. This should be the same as the name that we mapped in our Javascript file.
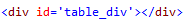
We have one last thing to do, and this is just to add a div to our view that will contain the table and its data.
And that's it!
The great advantages of using this API to help construct your tables is that it has features like Column formatting, paging and sorting, as well as the ability to totally manipulate the look and feel of your table. For more information on column formatting and paging please refer to the documentation. The API offers some additional features such as the ability to add Bar Formatters and Arrow Formatters.
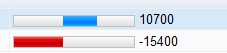
Bar Formatter
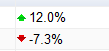
Arrow Formatter
I've created a small solution based on this tutorial.
 Download
For further reading on this API, please take a look at the following links.
http://code.google.com/apis/visualization/documentation/examples.html
http://code.google.com/apis/visualization/documentation/reference.html#DataTable